What is Visual Analytics?
Visual Analytics is closely related to Data Visualisation, which is also known as Information Visualisation, that helps users discover insights (from data) by presenting it visually. This takes advantage of the visual cognition system (brain is part of it), which is a very powerful computer for detecting certain patterns (we became very good at detecting patterns related to survival over the course of evolution). You have done data visualisation if you have created charts in Microsoft Excel or used tools such as Tableau.
The main difference is that Visual Analytics has a stronger emphasis on integrating with computational techniques, such as Machine Learning, to achieve even better results. In other words, Visual Analytics combines the power of human cognition and machine computation to support analytical reasoning.
What is Sensemaking?
Sensemaking means ‘make sense of something’. It is similar to other tasks such as data analysis, but with an emphasis on things that you are not familiar with, e.g., something you are doing for the first time. Let’s look at an example of ‘finding the best camera under £500 for baby photos‘: suppose you are expecting a baby and decide to get a new camera, but you are not an expert in (digital) photography and the process may look like:
- Searching for information about cameras, such as the reviews and recommendations for best cameras.
- Find the information that is relevant (filtering): matches the use case (for baby photos) and price range (no more than £500).
- Understand the information:
- Understand the concepts and terms, which may require further search, filtering, and reading (a repeat of step 1-3). And this can be recursive: the further search/reading may lead to even more new concepts, and so on.
- Understand which factors are important: for taking baby photos this may be about taking sharp photos with moving subjects (babies tend to move a lot), and what aspects of the camera affect this: sharp photos need fast shutter speed (to freeze the action) and this in turn needs large lens aperture (so there is enough light and the photo is not too dark).
- Building on the understanding, next you may come up with a few candidates:
- For example, you may want to find out within the budget which camera has the lens with the largest aperture. This may lead to more search/filter/understand (step 1-3), but this time it is more about the camera lens aperture, which is different from the topics of previous search/filter/understand.
- Sometimes there are alternative approaches, such as ‘will a iPhone camera be good enough?’ This will lead to another branch of search/filter/understand.
- Often you will compare the candidates. Besides the specs (such as aperture), this also includes availability (is the camera available in my country), price (which website has the best price), and is the online shop reputable (not a scam). This would result in many other search/filter/understand/compare.
- Finally, after you spend countless hours and eventually find the perfect fit, you need to communicate the results to your significant other, who knows less about camera than when you first started and wondering why we should spend so much money.
It turns out that there are many other tasks in our life fit into this pattern, such as planning a holiday and selecting a university/degree to study. This is not just for personal life, either. The two human-AI teaming projects, Qualitative Analysis and Generative AI support, are both sensemaking. Think about it: academic research can also be considered as sensemaking.
Research Challenges
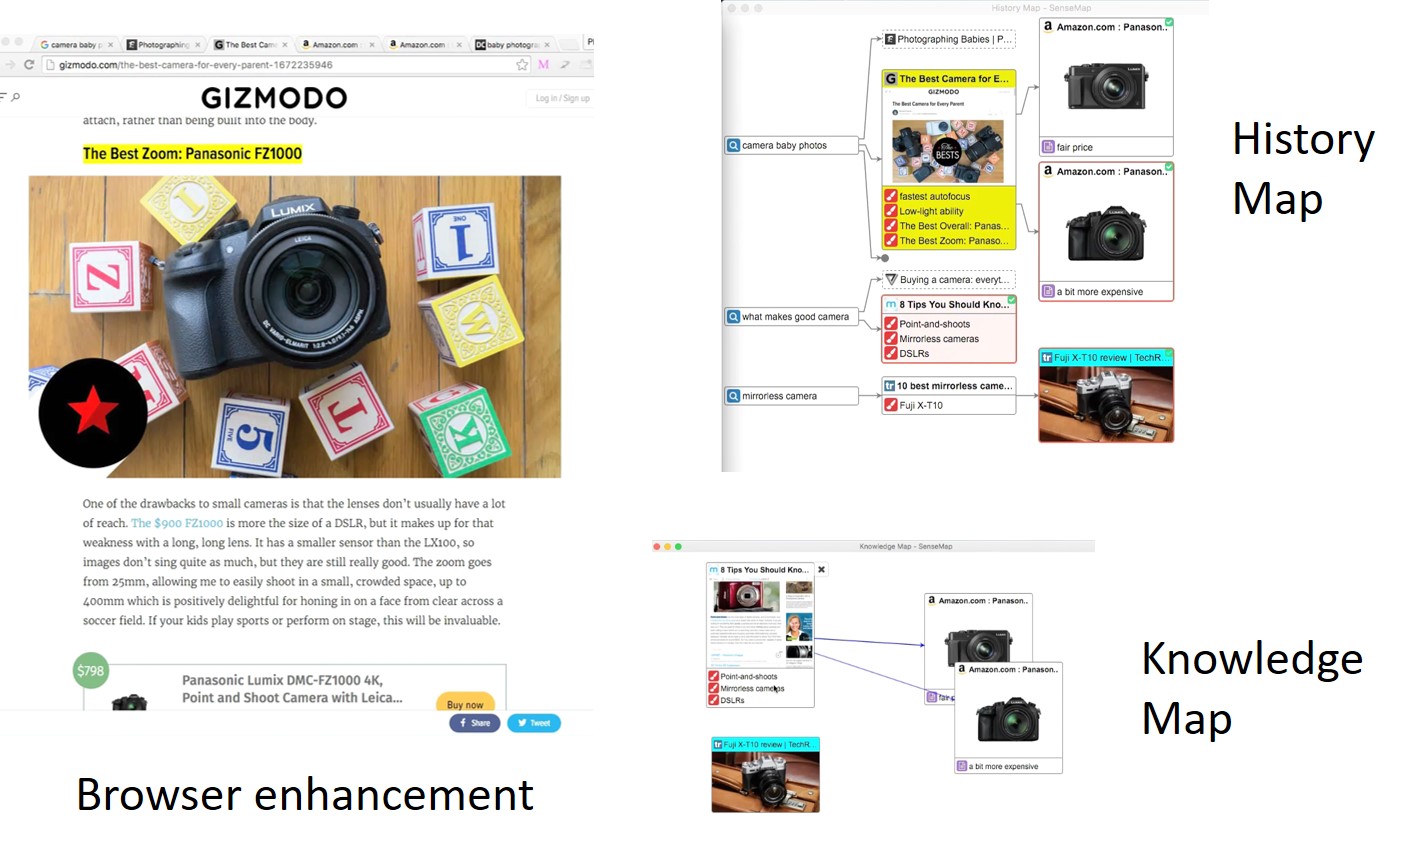
Back to the £500 camera example. Currently there is no solution to support this process end-to-end. The many search/filter/understand (step 1-3) often lead to dozens opened tabs (figure below). Most browsers treat this as a ‘tab management’ issue by providing functions such as ‘tab grouping’. However, I believe this needs to be addressed as a sensemaking challenge and needs a different type of solutions.

Some progress has been made along this direction with tools such as SenseMap (which is a chrome extension). It shows the browsing history as a tree-like structure and allows bookmarking website, text, and image. There is more information about SenseMap on its own webpage, including a video and the paper describing it. Also, we are actively developing it as an open-source project, please consider contributing if you are interested.
Research Questions
The problem is far from solved and there are still many open research questions:
- RQ1. Cover all the stages of Sensemaking: SenseMap was developed to support online sensemaking but it only covers Step 1 and 2 in the £500 camera example. More work is needed for the rest of the sensemaking pipeline (Step 3-5).
- RQ2. Support different use cases or application domains: SenseMap is designed for online shopping and it might not work well for other sensemaking tasks such as applying for a master/PhD or building a machine learning model. There are lots of opportunities to develop for different sensemaking tasks.
- RQ3. Sensemaking sharing: some sensemaking tasks are repeated by many people. For example, there are many students who are thinking about or applying for a master or PhD degree. If we can share such process, i.e., how one user research and compare different universities and degrees, others can save a lot of efforts by adjusting it to their needs.
- RQ4: collaborative sensemaking: In addition, we can also allow a team to perform sensemaking collaboratively, e.g., a group of friends planning a holiday together.
- RQ5. Relative ranking: when you shopping on website like Amazon, a search can return hundreds if not thousands products. Many of these would have similar review scores, and it can be difficult to find the ‘right’ one. One can buy a few of these and decide which one is the most suitable. Besides sharing the sensemaking process, if we can have many 1-to-1 comparisons of different product aspects through crowd sourcing, we can have the relative ranking among the options and make the choice much easier. This would allow a more nuanced comparison between different aspects, such as the relative ranking of the product build quality or usability, allowing users to prioritise the aspect according their unique needs. For example, one user may care very much about the build quality but not usability, and he/she may get a very different relative ranking comparing to someone that prefers usability over build quality.
Machine Learning and Large Language Models (LLMs)
Machine learning and LLMs can play a very important role in support sensemaking. For example, LLM can be used to automatically create a table to help user compare different options. There are many other tasks that machine learning can help:
- Understand what sensemaking task users are performing, e.g., are they buying a phone online or planning a holiday trip, so better support can be provided.
- Identify relevant tabs: among the 30 opened browser tabs, which ones are relevant to the current sensemaking task, so the rest (e.g., chatting with friends) can be minimised to reduce clutter and help user organise/focus.
- (Automatically) detect when user needs help, e.g., not sure how to use the tool, and provides the help needed.
- Many other possibilities …
Previous Projects
Here are some previous student projects: project1 and project2.
Readings
- SenseMap: Supporting Browser-based Online Sensemaking through Analytic Provenance (webpage, Github, presentation)
- Survey on the Analysis of User Interactions and Visualization Provenance (website, presentation)
- From Information to Choice: A Critical Inquiry Into Visualization Tools for Decision Making (TVCG 2023)
Event sequence analysis
- A Survey on Visual Analysis of Event Sequence Data: https://ieeexplore.ieee.org/document/9497654/
Multi-Attribute Comparison
- LineUp: Visual Analysis of Multi-Attribute Rankings (TVCG 2013)
- SkyLens: Visual Analysis of Skyline on Multi-Dimensional Data (TVCG 2018)
- Podium: Ranking Data Using Mixed-Initiative Visual Analytics (TVCG 2018)
- RankAxis: Towards a Systematic Combination of Projection and Ranking in Multi-Attribute Data Exploration (TVCG 2023)

You must be logged in to post a comment.