Background
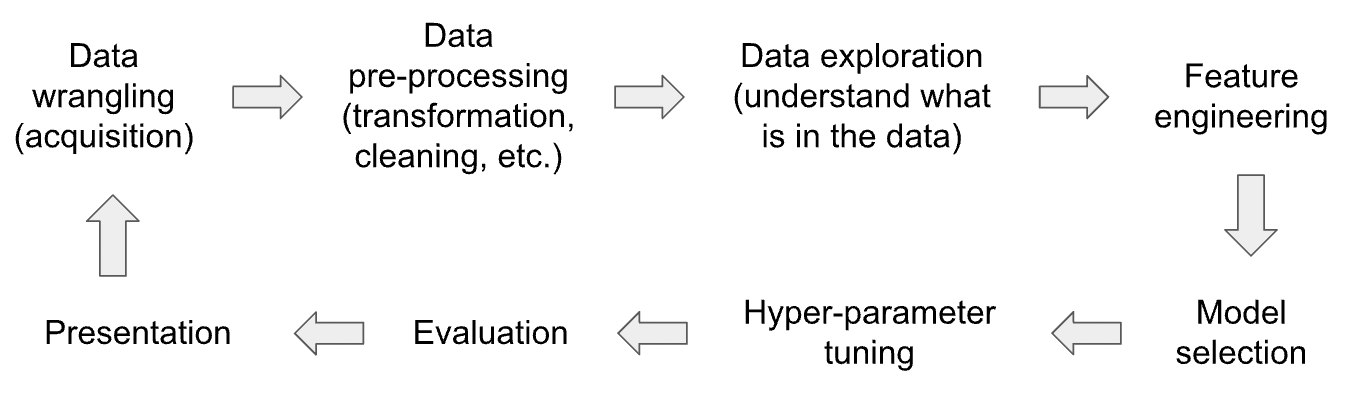
While there are some efforts to automate the process of build machine learning model (commonly known as ‘AutoML‘), there are many tasks in the different stages of a data science pipeline (see the diagram below) cannot be fully automated. For example, for ‘Data Wrangling’ a decisions have to be made on which dataset to use and what pre-processing to be performed, and these cannot be easily automated.
Currently there is very little support for these manual tasks: user would start a Jupyter notebook and add different code blocks for data wrangling, cleaning, and so on. User would use try-and-error to test different options such as features/models/hyper-parameters until acceptable performance is achieved (or time runs out).
For example, hyperparameters are important to the performance of machine learning models. However, some models have many parameters and each parameter has many possible values, if not infinite. As a result, finding the best set of values for the hyperparameters can be time consuming. Currently people rely on previous experiences or methods such as ‘grid search’, but these do not always work or provide good answers.
Hyperparameter is just one part of the data science pipeline. When a different model is used, all the hyperparameters have to be tested again. When a feature is changed or a new feature is added, all the models and their hyperparameters have to be tested again. Manually tracking this exponential number of combinations is not practically possible.
Research Question (Project Idea)
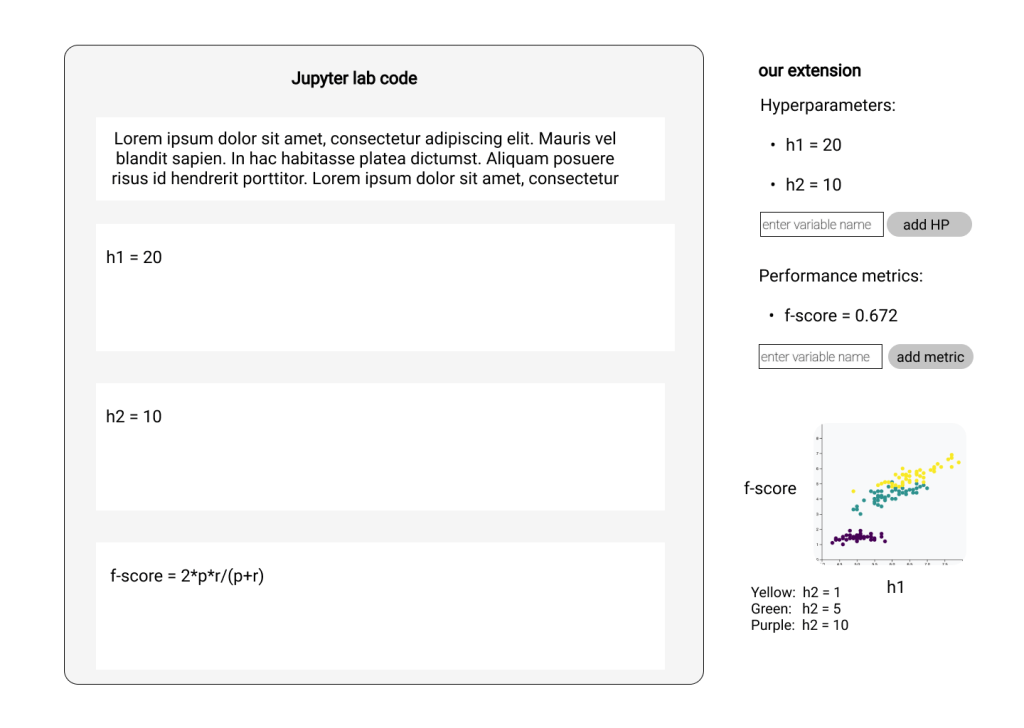
This project aims to provided the much-needed support so users can easily track and make sense of the results of all the data/feature/model/hyperparameter combinations. As a first step, we aim to capture the changes in a Jupyter Notebook and its impact on the output. For example, the changes can be the values of hyperparameters and the impact is the resulting change of ML performance. The figure above is a mockup for hyperparameter tuning, and this can be applied to all other aspects of machine learning such as data/feature/model.
The plan is to first support these aspects separately and eventually support the entire workflow as a whole.
Readings
- Verdant has a list-based visualisation (demo on youtube).
- The loops is being actively developed as a replacement for the JupyterLab Notebook Provenance extension.
- MLProvLab is an JupyerLab extension that can capture the changes in a notebook (tutorial);
- On the Design of AI-powered Code Assistants for Notebooks (CHI 2023)
- Hypterparameter: HyperTendril: Visual Analytics for User-Driven Hyperparameter Optimization of Deep Neural Networks

You must be logged in to post a comment.