Author: Kai
-
PC member, International Workshop on Internet-based Virtual Computing Environment
The iVCE 2O14 workshop will be held in Oxford, UK in April 2014, part of the 8th IEEE international Symposium on service-Oriented System Engineering. The deadline is 7 December 2014.
-
Funding: Multiple Source Information Assimilation to Support Decision-Making (2013-2015, £200k)
A £200k two-year project funded by the Defence Human Capability Science & Technology Centre. The project applies Visual Analytics technique to support sense making in intelligence analysis and I will be working with collaborators from BAE systems, MASS, and Cranfield university.
-
TVCG/VAST 2013: An Extensible Framework for Provenance in Human Terrain Visual Analytics
The paper is accepted by the VAST 2013 conference and will appear in the IEEE Transactions on Visualization and Computer Graphics. It provides visualisation for different uncertainties in Human Terrain Analyisis and a way to construct narratives of the visual exploration discoveries. PDF
-
Visual Analytics Summer School 2013 Tutorial: Graph (Network) Visualisation
This is presented at the Visual Analytics Summer School 2013, and below are the slides
-
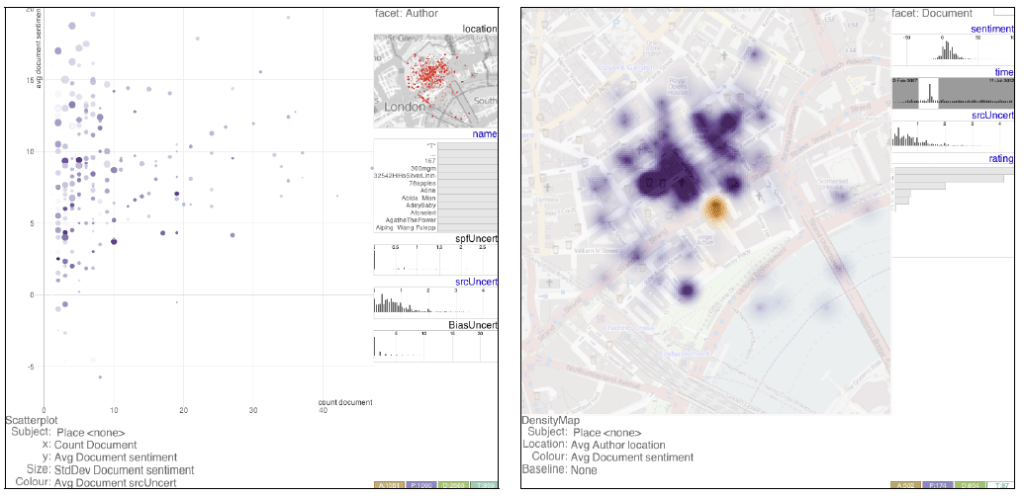
Concern Level Assessment: Building Domain Knowledge into a Visual System to Support Network Security Situation Awareness
This is the journal paper about the VAST Challenge 2012 award. It is accepted by the Information Visualisation journal and will appear shortly. PDF
-
Program Committee (PC) member, International Conference on Information Visualization Theory and Applications” (IVAPP) 2014
IVAPP 2014 is a relatively new and quite nice visualisation conference.
-
Dagstuhl Seminar: Information Visualization – Towards Multivariate Network Visualization
This is the second Dagstuhl Seminar I attended this year. Just as before, it is very interesting and intensive. Met several old friends and got to make a lot new friend. I am busy writing a book chapter on Multivariate Network Visualization now as the result.
-
Dagstuhl Seminar: Drawing Graphs and Maps with Curves
Dagstuhl Seminar is an invitation only workshop that experts from all over the world to work on a specific topic intensively for a week in a remote research institute (an old castle) in Germany. This one is about curved edges in graph visualisation, which I just did a study last year.

You must be logged in to post a comment.