Category: Networks
-
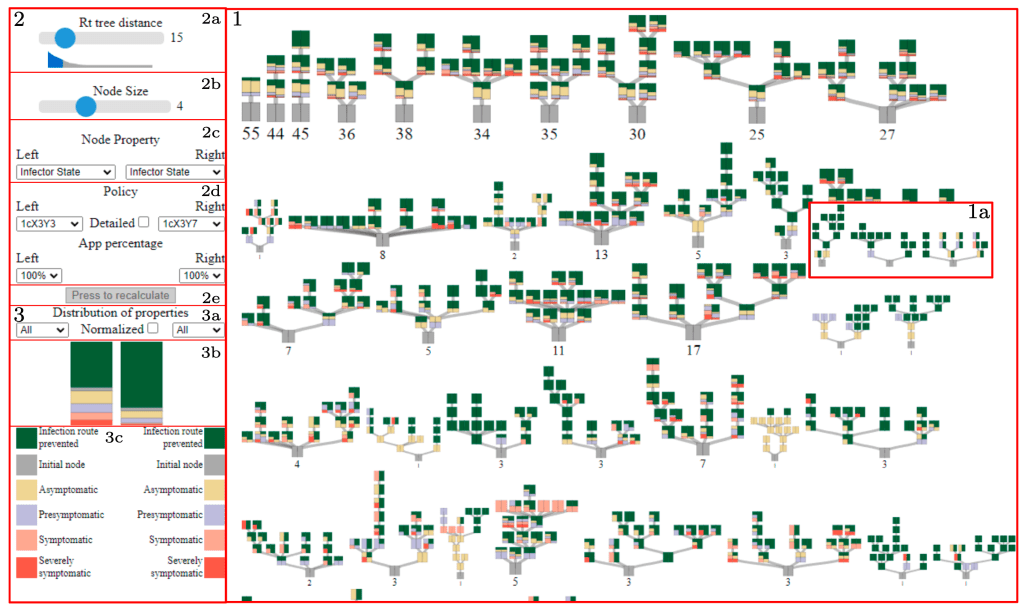
Visual Analytics of Contact Tracing Policy Simulations During an Emergency Response
EuroVis 2022 🏆 Best Paper Honorable Mention/ Computer Graphic Forum Open access: https://onlinelibrary.wiley.com/doi/full/10.1111/cgf.14520 Epidemiologists use individual-based models to (a) simulate disease spread over dynamic contact networks and (b) to investi- gate strategies to control the outbreak. These model simulations generate complex ‘infection maps’ of time-varying transmission trees and patterns of spread. Conventional statistical analysis of…
-
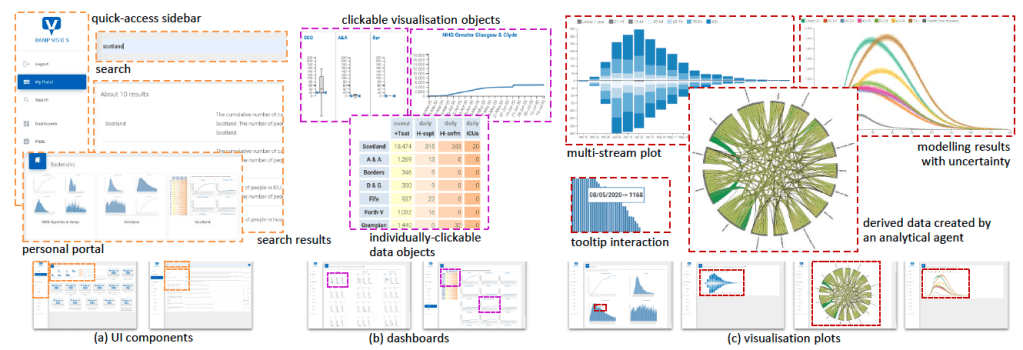
RAMPVIS: Answering the Challenges of Building Visualisation Capabilities for Large-scale Emergency Responses
Epidemics (journal) This paper describes the collaborative efforts from the RAMPVIS consortium to help the epidemiologists modelling the various aspects of Covid19, including the spread of the disease and the impact of different isolation policies. Started as a voluntary effort, there are many challenges faced by the group of close to 20 visualisation experts, including…
-

Phong Nguyen, 2017, PhD in Computer Science
Data Scientist at Red Sift, 2011-2017, “Spatial-Temporal Analysis of Online Social Information and its Provenance using Visual Analytics”, School of Engineering and Information Sciences, Middlesex University, UK.
-
Visual Analytics Summer School 2013 Tutorial: Graph (Network) Visualisation
This is presented at the Visual Analytics Summer School 2013, and below are the slides
-
Dagstuhl Seminar: Information Visualization – Towards Multivariate Network Visualization
This is the second Dagstuhl Seminar I attended this year. Just as before, it is very interesting and intensive. Met several old friends and got to make a lot new friend. I am busy writing a book chapter on Multivariate Network Visualization now as the result.
-
Dagstuhl Seminar: Drawing Graphs and Maps with Curves
Dagstuhl Seminar is an invitation only workshop that experts from all over the world to work on a specific topic intensively for a week in a remote research institute (an old castle) in Germany. This one is about curved edges in graph visualisation, which I just did a study last year.
-
Reviewer, IEEE PacificVis 2013
The conference will be in Sydney, Australia next year and I really hope I can attend.
-
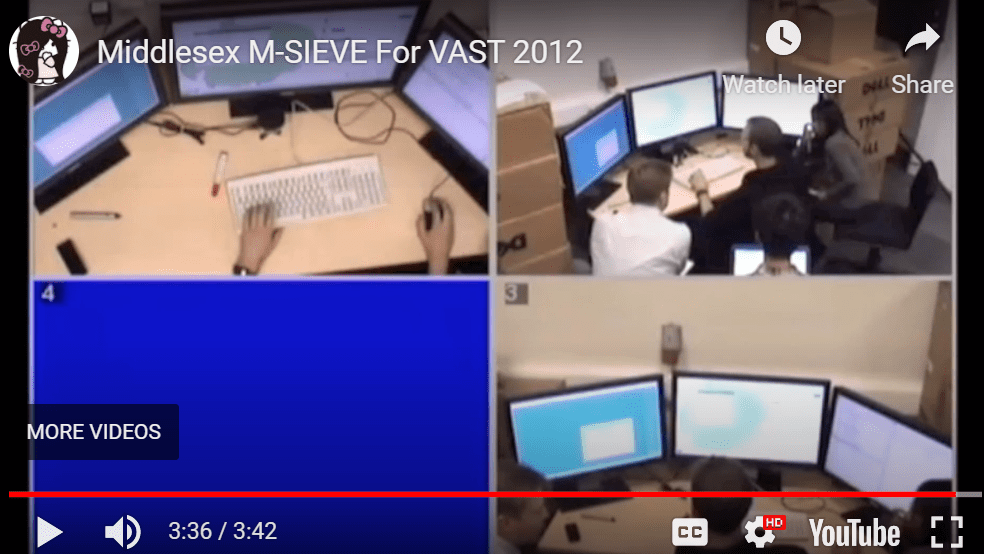
VAST Challenge 2012 – Subject Matter Expert’s Award
This is an entry to the Mini Challenge 1 of the VAST Challenge 2012. The details are here. Below is a video describing the solution.
-
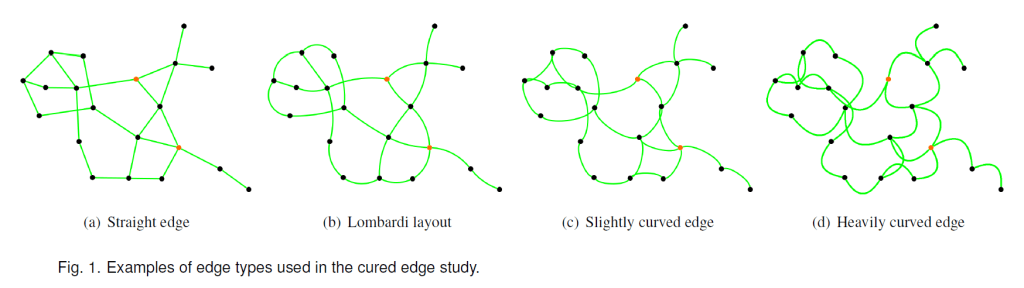
InfoVis 2012 paper! A User Study on Curved Edges in Graph Visualisation
This is an extended version of the work presented as a poster at Diagrams 2012 with new user study and analysis. Kai Xu, Chris Rooney, Peter Passmore, and Dong-Han Ham, “A User Study on Curved Edges in Graph Visualisation”, IEEE Information Visualization Conference, 14-29 October 2012, Seattle, US. PDF

You must be logged in to post a comment.