EuroVis 2022 🏆 Best Paper Honorable Mention/ Computer Graphic Forum
Open access: https://onlinelibrary.wiley.com/doi/full/10.1111/cgf.14520
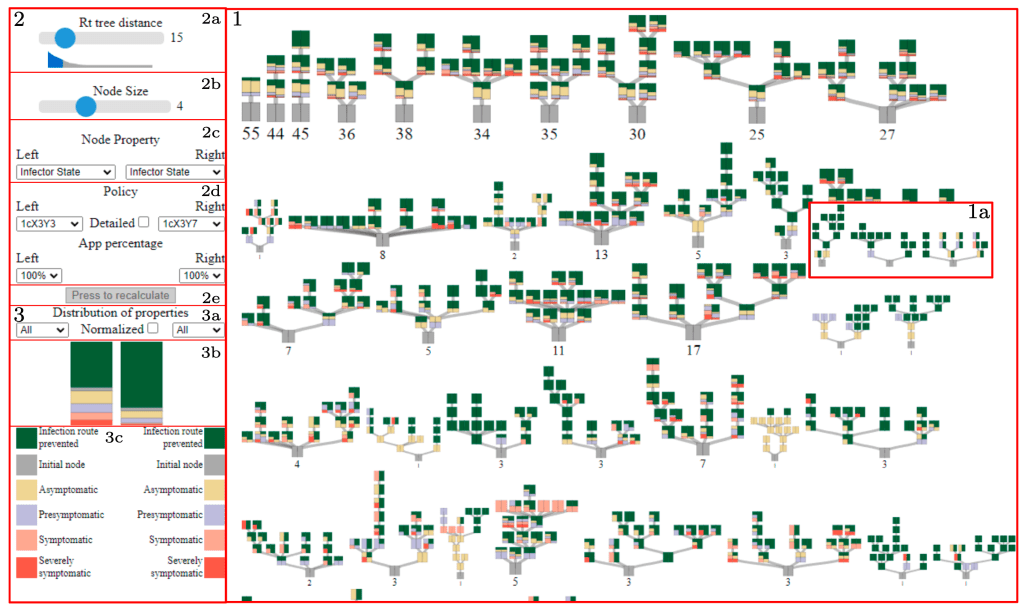
Epidemiologists use individual-based models to (a) simulate disease spread over dynamic contact networks and (b) to investi- gate strategies to control the outbreak. These model simulations generate complex ‘infection maps’ of time-varying transmission trees and patterns of spread. Conventional statistical analysis of outputs offers only limited interpretation. This paper presents a novel visual analytics approach for the inspection of infection maps along with their associated metadata, developed col- laboratively over 16 months in an evolving emergency response situation. We introduce the concept of representative trees that summarize the many components of a time-varying infection map while preserving the epidemiological characteristics of each individual transmission tree. We also present interactive visualization techniques for the quick assessment of different control policies. Through a series of case studies and a qualitative evaluation by epidemiologists, we demonstrate how our visualizations can help improve the development of epidemiological models and help interpret complex transmission patterns.
