Category: Visual Analytics
-
Provenance for Sensemaking Workshop at IEEE VIS 2014 (Paris, France)
I am co-chairing a workshop on Provenance and Sensemaking at the IEEE VIS conference week in Paris. The submission deadline has now passed, but you can still join the discussions at the workshop during the conference. Hope to see you there!
-

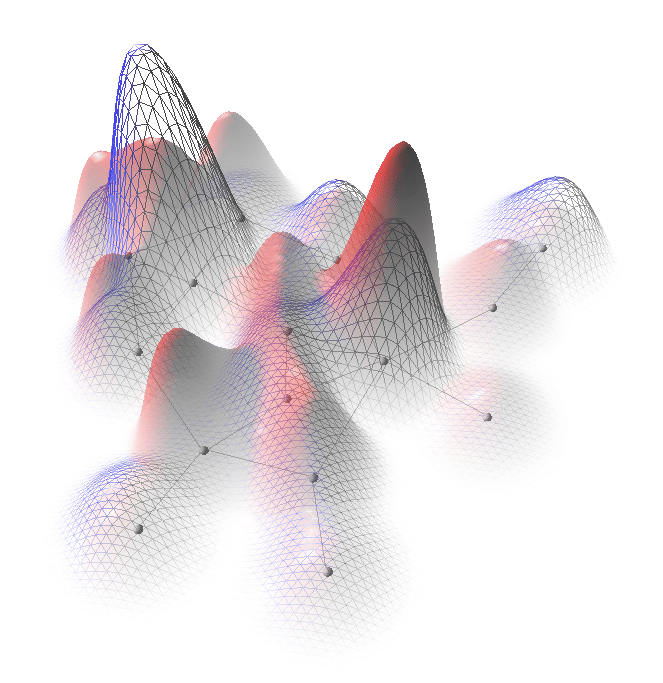
High-Dimensional Visualisation for Big Data (2014-2015, £20k)
A data visualisation project to understand how interactive projection technique can help user improve their understanding of data with very high dimensionality.
-
Book chapter on Multivariate Network Visualisation
T. J. Jankun-Kelly, T. Dwyer, D. Holten, C. Hurter, M. Nöllenburg, C. Weaver, and K. Xu, “Scalability Considerations for Multivariate Graph Visualization,” in Multivariate Network Visualization, A. Kerren, H. C. Purchase, and M. O. Ward, Eds. Springer International Publishing, 2014, pp. 207–235. PDF. Multivariate network is a quite challenging problem: it involves both the network structure…
-

A.Ian Kruger, 2014, Master by Research in Visual Analytics
Data and Management reporting at Middlesex University, Started: June 2012, Project : Making Sense of Big Data, Ian ran his own boutique research company that covered a wide range of topic from website quality analytics to industry research.
-
Funding: Multiple Source Information Assimilation to Support Decision-Making (2013-2015, £200k)
A £200k two-year project funded by the Defence Human Capability Science & Technology Centre. The project applies Visual Analytics technique to support sense making in intelligence analysis and I will be working with collaborators from BAE systems, MASS, and Cranfield university.
-
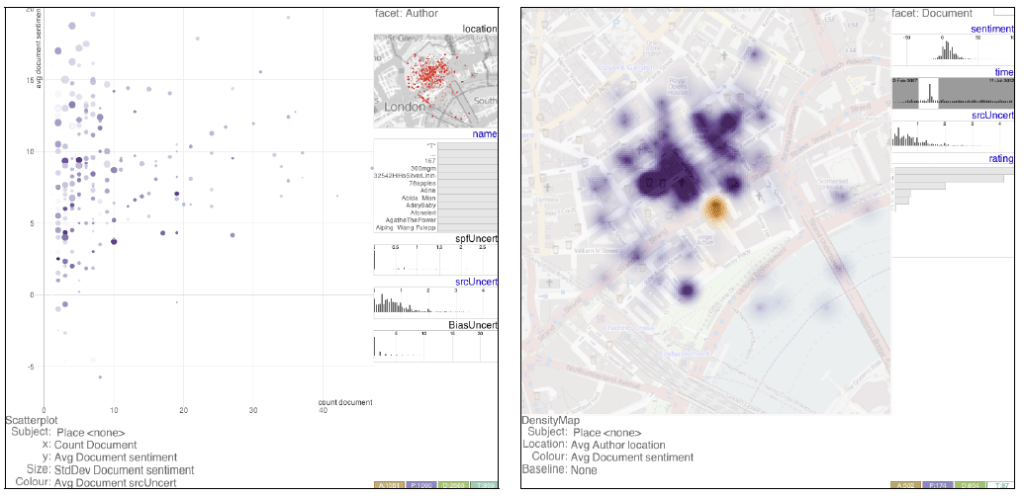
TVCG/VAST 2013: An Extensible Framework for Provenance in Human Terrain Visual Analytics
The paper is accepted by the VAST 2013 conference and will appear in the IEEE Transactions on Visualization and Computer Graphics. It provides visualisation for different uncertainties in Human Terrain Analyisis and a way to construct narratives of the visual exploration discoveries. PDF
-
Visual Analytics Summer School 2013 Tutorial: Graph (Network) Visualisation
This is presented at the Visual Analytics Summer School 2013, and below are the slides

You must be logged in to post a comment.