Category: Visual Analytics
-
Concern Level Assessment: Building Domain Knowledge into a Visual System to Support Network Security Situation Awareness
This is the journal paper about the VAST Challenge 2012 award. It is accepted by the Information Visualisation journal and will appear shortly. PDF
-
Program Committee (PC) member, International Conference on Information Visualization Theory and Applications” (IVAPP) 2014
IVAPP 2014 is a relatively new and quite nice visualisation conference.
-
Dagstuhl Seminar: Information Visualization – Towards Multivariate Network Visualization
This is the second Dagstuhl Seminar I attended this year. Just as before, it is very interesting and intensive. Met several old friends and got to make a lot new friend. I am busy writing a book chapter on Multivariate Network Visualization now as the result.
-
Dagstuhl Seminar: Drawing Graphs and Maps with Curves
Dagstuhl Seminar is an invitation only workshop that experts from all over the world to work on a specific topic intensively for a week in a remote research institute (an old castle) in Germany. This one is about curved edges in graph visualisation, which I just did a study last year.
-
Reviewer, IEEE PacificVis 2013
The conference will be in Sydney, Australia next year and I really hope I can attend.
-
Reviewer, IEEE Transaction on Visualization and Computer Graphics (Impact Factor 2.215)
Reviewer, IEEE Transaction on Visualization and Computer Graphics. As usual, I can’t say much about the paper being reviewed, but certainly this is a very good journal.
-
VAST Challenge 2012 – Subject Matter Expert’s Award
This is an entry to the Mini Challenge 1 of the VAST Challenge 2012. The details are here. Below is a video describing the solution.
-
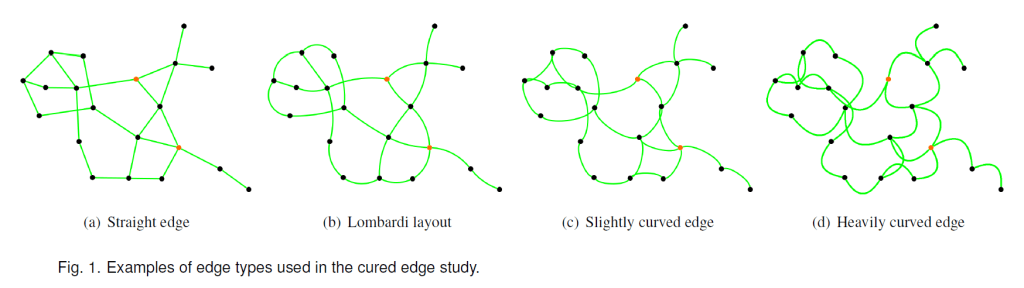
InfoVis 2012 paper! A User Study on Curved Edges in Graph Visualisation
This is an extended version of the work presented as a poster at Diagrams 2012 with new user study and analysis. Kai Xu, Chris Rooney, Peter Passmore, and Dong-Han Ham, “A User Study on Curved Edges in Graph Visualisation”, IEEE Information Visualization Conference, 14-29 October 2012, Seattle, US. PDF
-
Visual Analytics Summer School 2012, London, UK
“Graph Layout Methods and Their Visual Perception”, Visual Analytics Summer School, August 2012, London, UK
-
Reviewer, IBM Journal of Research and Development (Impact factor 4.8)
Reviewer, IBM Journal of Research and Development (Impact factor 4.8).

You must be logged in to post a comment.