Author: Kai
-

VizTIG: The Visualization interest group at the Alan Turing Institute
https://www.turing.ac.uk/research/interest-groups/visualization Visualization research and innovation has become critical to data science, it bridges the gap between digital data and human cognition. It is also emerging as an important methodology for helping visualize how machine learning and AI systems arrive at decisions, while clearly illustrating any bias in those decisions. The visualization interest group (VizTIG) meets regularly…
-
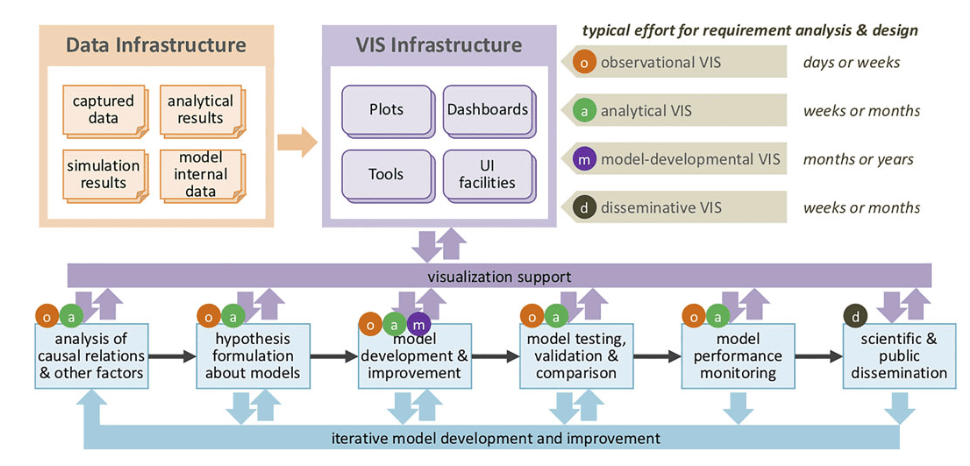
Visualization for epidemiological modelling: challenges, solutions, reflections and recommendations
Philosophical Transactions of the Royal Society A: Mathematical, Physical and Engineering Sciences (Impact Factor 5.0) Open access: https://royalsocietypublishing.org/doi/full/10.1098/rsta.2021.0299 We report on an ongoing collaboration between epidemiological modellers and visualization researchers by documenting and reflecting upon knowledge constructs—a series of ideas, approaches and methods taken from existing visualization research and practice—deployed and developed to support modelling…
-
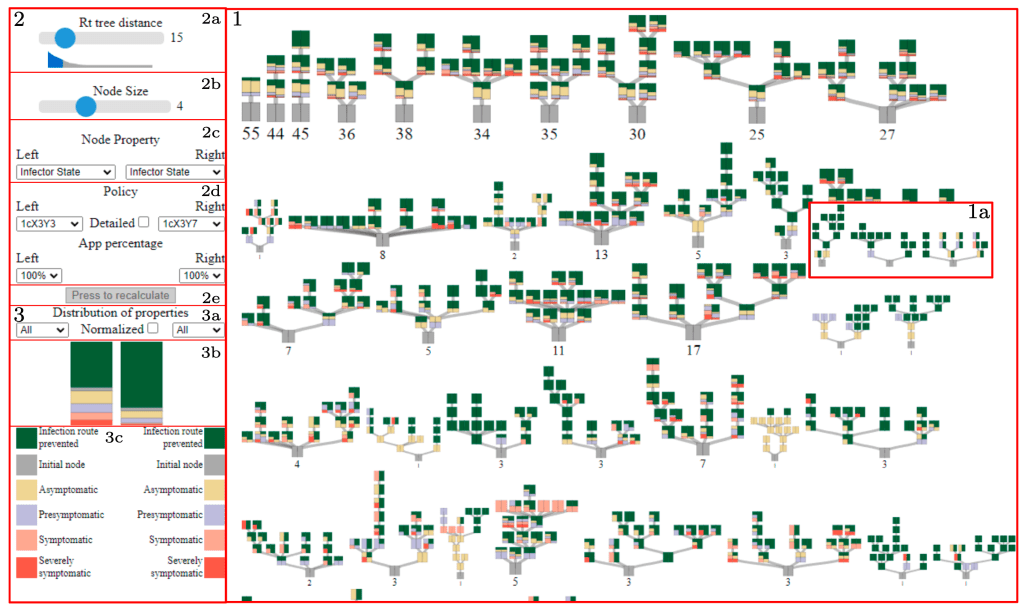
Visual Analytics of Contact Tracing Policy Simulations During an Emergency Response
EuroVis 2022 🏆 Best Paper Honorable Mention/ Computer Graphic Forum Open access: https://onlinelibrary.wiley.com/doi/full/10.1111/cgf.14520 Epidemiologists use individual-based models to (a) simulate disease spread over dynamic contact networks and (b) to investi- gate strategies to control the outbreak. These model simulations generate complex ‘infection maps’ of time-varying transmission trees and patterns of spread. Conventional statistical analysis of…
-

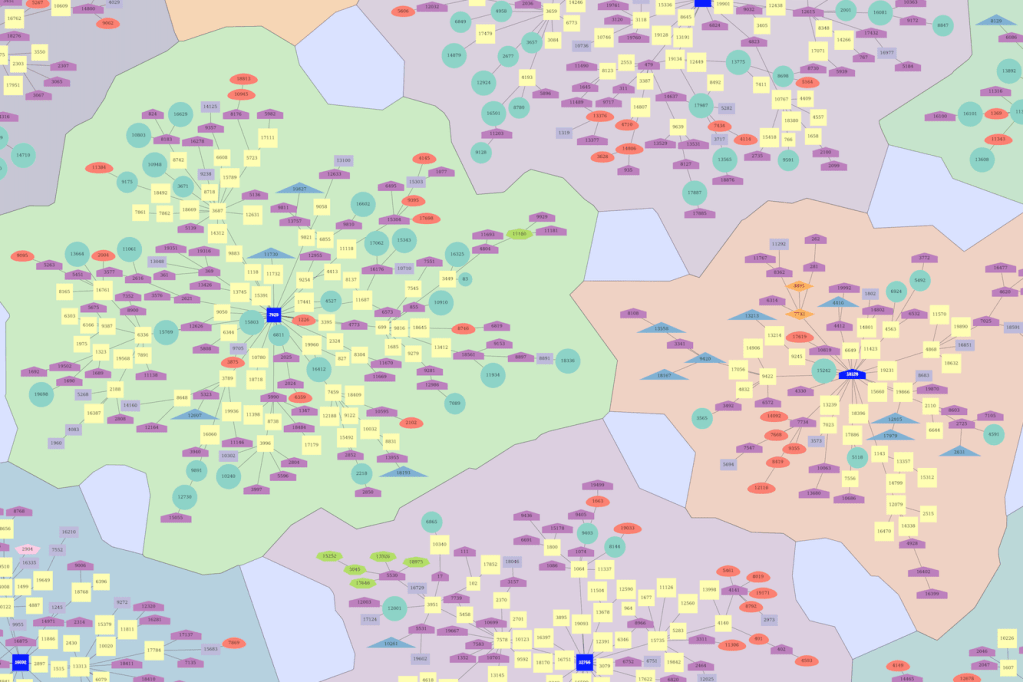
Provectories: Embedding-based Analysis of Interaction Provenance Data
IEEE Transaction on Visualisation and Computer Graphics (TVCG) Understanding user behavior patterns and visual analysis strategies is a long-standing challenge. Existing approaches rely largely on time-consuming manual processes such as interviews and the analysis of observational data. While it is technically possible to capture a history of user interactions and application states, it remains difficult…
-
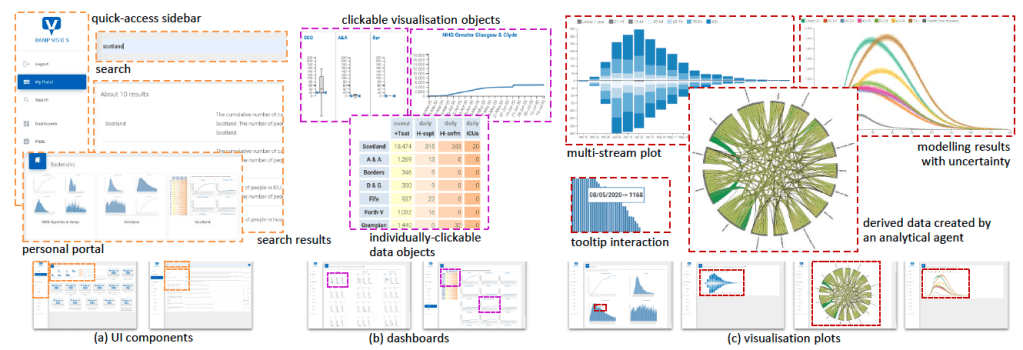
RAMPVIS: Answering the Challenges of Building Visualisation Capabilities for Large-scale Emergency Responses
Epidemics (journal) This paper describes the collaborative efforts from the RAMPVIS consortium to help the epidemiologists modelling the various aspects of Covid19, including the spread of the disease and the impact of different isolation policies. Started as a voluntary effort, there are many challenges faced by the group of close to 20 visualisation experts, including…
-

PC co-chair for Computer Graphics and Visual Computing (CGVC) 2021
The Computer Graphics and Visual Computing (CGVC) conference is the annual conference organised by EuroGraphics UK chapter. It covers everything Visualisation related, including graphics, games, AR/VR, and data visualisation. This is the second year the conference is completely online because of the covid19. There is more information on the conference website.
-

Expert Fellow of the EPSRC SPRITE+ Network
SPRITE+ is a research network funded by EPSRC, the UK research council on engineering and physical sciences. The focus of the research network is ‘Security, Privacy, Identity, Trust in the Digital Economy’. ‘Its academic Expert Fellows enable SPRITE+ to develop a multidisciplinary approach to realising its vision. Fellows provide intellectual leadership, take a leading role…
-
RAMP VIS – Visual Analytics for Covid-19 (2021-2022, £430,000)
EPSRC, 2021-2022, £430,000 This is a collaborative efforts with many visualisation researchers across the UK to provide visual analytics support in the fight against Covid-19. It started as a volunteer effort, led by Prof. Min Chen from Oxford University. A team of 20 visualisation researchers from over 10 different universities worked closely with epidemiologists who…
-

-